Biomine Explorer
Link discovery and interactive exploration in biological databases
Biomine graphs
Biomine graphs are exported in a simple text format. Each line in the files provided below describes one link (edge), e.g.,
node1 node2 link_type link_goodness
where link_goodness can be interpreted as the probability that link e represents an actually existing, relevant and informative relationship. It is computed as a product of three factors: relevance, informativeness and reliability. In addition, the first few lines in the beginning of each file specify which link types are symmetric.
License
Biomine graphs are integrated from several sources and are therefore a derived work. As such, we can offer Biomine graphs only for academic and non-commercial use.
How to cite
If you use Biomine graphs in your research, please cite the following publication:
@article{biomine2019,
author = {Podpečan, Vid and Ramšak, Živa and Gruden, Kristina and Toivonen, Hannu and Lavrač, Nada},
title = {Interactive exploration of heterogeneous biological networks with Biomine Explorer},
journal = {Bioinformatics},
year = {2019},
month = {06},
issn = {1367-4803},
doi = {10.1093/bioinformatics/btz509},
url = {https://doi.org/10.1093/bioinformatics/btz509}}
Download
Three groups of graphs are available, one for each organism set (see here for more details):
- biomine: biomine_10_jun_2021.zip (1,883,386 nodes, 34,051,650 edges)
older version: biomine_3_oct_2018.zip (1.508.587 nodes, 32.761.889 edges) - human: human_3_oct_2018.zip (861.812 nodes, 8.666.287 edges)
- plants: plants_2_aug_2018.zip (1.737.984 nodes, 4.125.274 edges)
Visualization
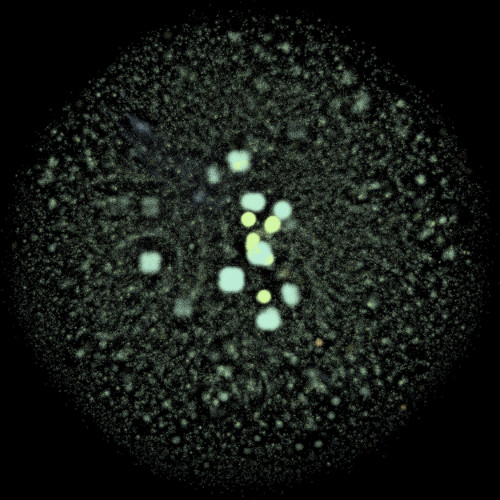
Below are visualizations of Biomine graphs (nodes only) and the legend. Click on the picture to get a full resolution image.


